Analyzing Recent Trends in U.S. Financial Markets and Technology
Written on
Overview of U.S. Financial Markets
During the recent holiday-shortened week, the technology sector regained its popularity within U.S. markets. The Nasdaq index, which lagged behind other major averages in the first quarter, experienced a 2.6% increase, outperforming the S&P 500's rise of 1.4% and the Dow's modest gain of 0.2%. Tesla emerged as a significant performer among the large-cap stocks, while Treasury yields showed strong upward movements, surpassing 1.75% on Tuesday and stabilizing above 1.7% by Friday. Notably, the U.S. job report exceeded expectations with a remarkable addition of 916,000 jobs in March, resulting in a 0.2 percentage point drop in the unemployment rate to 6%. This data clearly illustrates the robust recovery of the economy.
The beginning of April marked a significant milestone as the S&P 500 index breached the 4,000 mark, achieving this landmark just minutes into trading and closing at 4,019, reflecting a gain of over 1%. This swift ascent from 3,000 to 4,000 in merely 434 trading days represents the fastest 1,000-point leap in the index's history, according to Dow Jones Market Data. Investors are now eagerly anticipating the announcement of a more than $2 trillion infrastructure spending initiative by the U.S. President.
The U.S. dollar maintained its upward trajectory, particularly against the euro, which declined sharply due to a pessimistic regional outlook and fears surrounding a third COVID-19 wave. The DXY index benefited from the strong recovery of the U.S. economy, closing above the 93.00 mark and remaining within a bullish channel in the short term.
Cryptocurrency Market Developments
As the cryptocurrency market stabilized, signs of a resurgence in alternative coins began to emerge. Although Bitcoin faced challenges in breaking through the $60,000 threshold, Ethereum's significant gains propelled it to a new all-time high (ATH) of nearly $2,150, hovering around $2,078 at the time of this report. Bitcoin's market dominance, which has remained around 60%, is starting to decline, hinting at the potential onset of an altcoin season.
The accompanying infographic from Visual Capitalist, sourced from New York Life Investments, illustrates the dynamics of stock ownership in the U.S. market— the largest globally— with total ownership reaching nearly $40 trillion by 2019. Notably, foreign investors now hold the largest share, with their ownership rising from approximately 5% in 1965 to an impressive 40% in 2019.
Weekly Financial Overview
Here are some key figures from various financial markets and asset classes before we delve into further statistics.
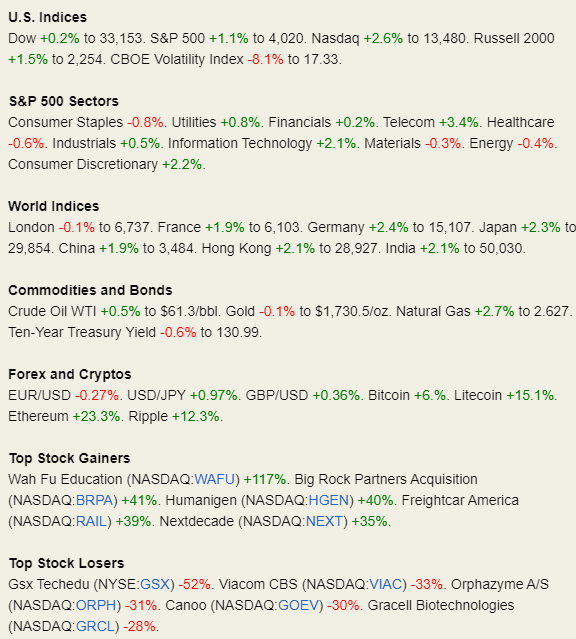
Figure 1 — Insights on U.S. Corporate Profits
This visualization from Howmuch.net, based on data from the U.S. Bureau of Economic Analysis (BEA), highlights the distribution of U.S. corporate profits between domestic and international markets. The detailed infographic (Figure 2) reveals both a high-level overview of U.S. corporate profits and specific statistics by industry.
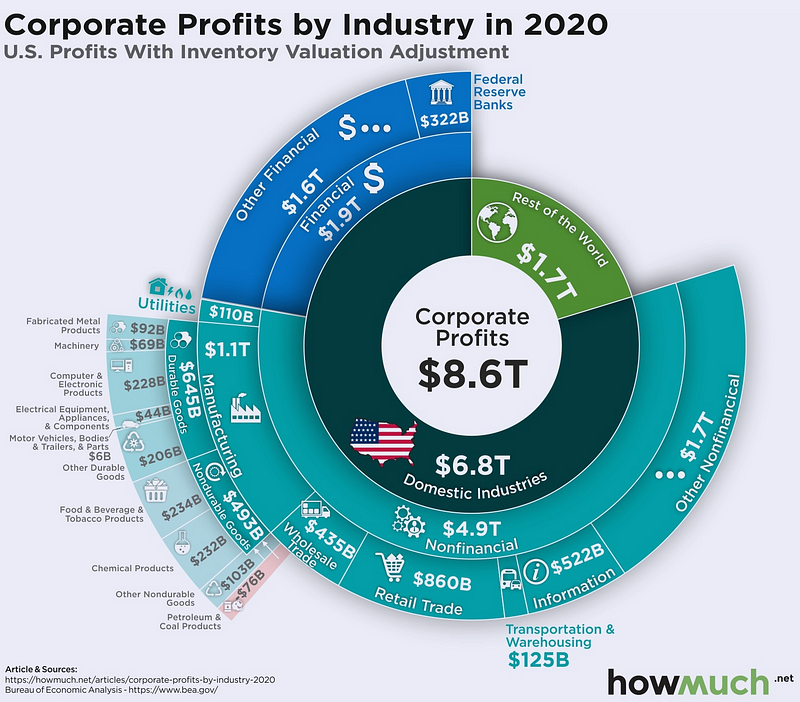
Figure 2 — NFT Trading Volume Surge in 2021
Since their inception around 2017, Non-Fungible Tokens (NFTs) have witnessed a dramatic increase in popularity, especially in 2021. According to NonFungible.com, NFT trading volumes on the Ethereum blockchain surpassed $500 million, with nearly half of that total occurring in just the past month. The sales figures for NFTs from various marketplaces have skyrocketed, showing a staggering 766% month-over-month increase in February (Figure 3).
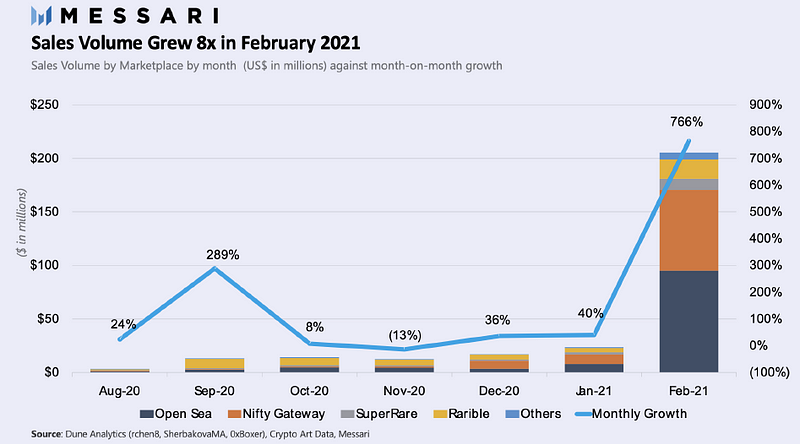
Figure 3 — Mapping America's Wealthiest Families
The infographic below (Figure 4) showcases the 50 wealthiest families in America, collectively holding an astounding $1.2 trillion. This ranking transcends typical family units and self-made fortunes, focusing instead on the wealth of multi-generational families. The data from Forbes reveals the enterprises that have contributed to their immense wealth.
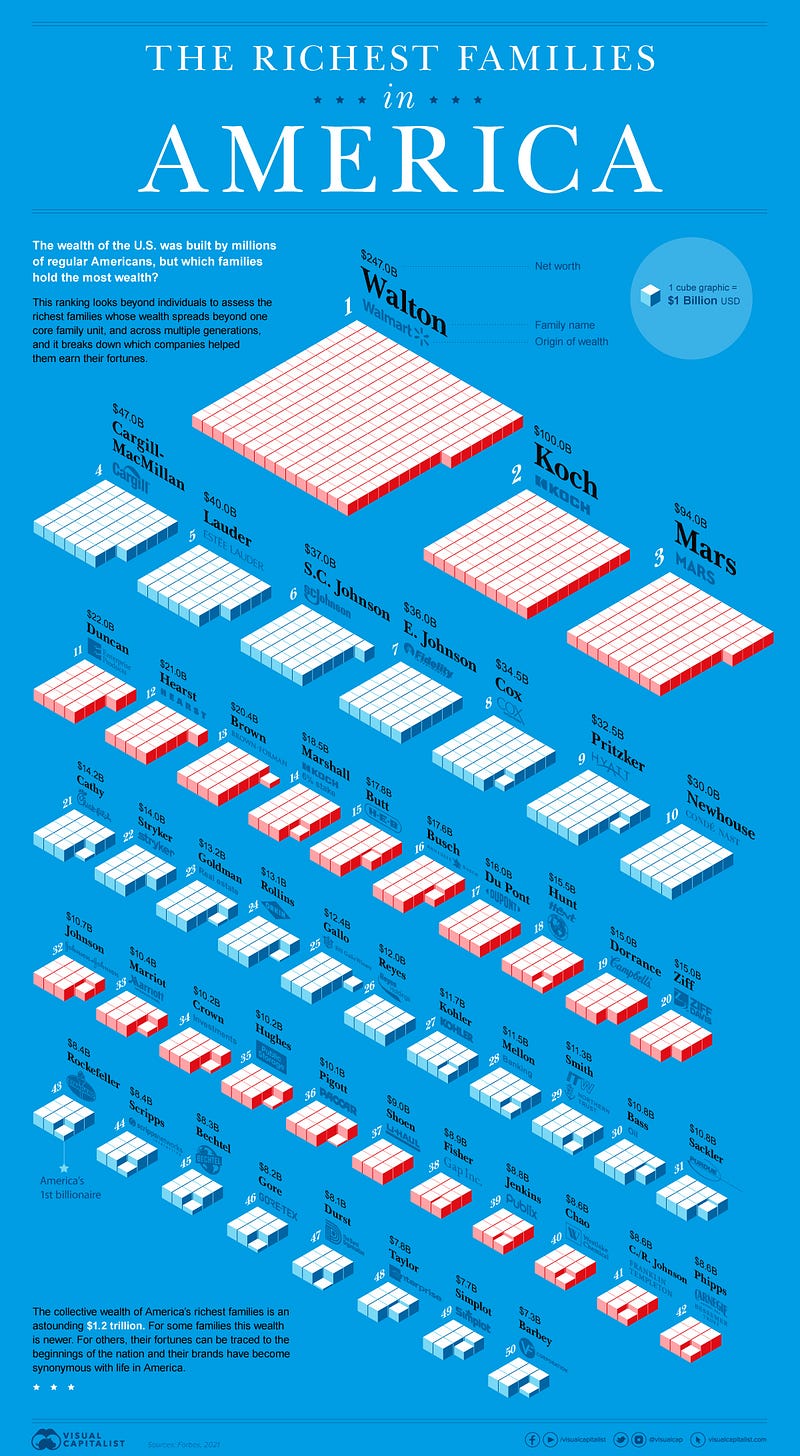
Figure 4 — Regional Wealth Growth (1820–2018)
Continuing with the theme of wealth, the chart (Figure 5) from Our World in Data illustrates the growth of GDP per capita across various regions over the last two centuries. Generally, most regions have experienced growth post-World War II, but the most significant increases have been noted in the last twenty years. The Western hemisphere leads in wealth growth, while Sub-Saharan Africa shows minimal progress, and South & Southeast Asia have seen the least increase.
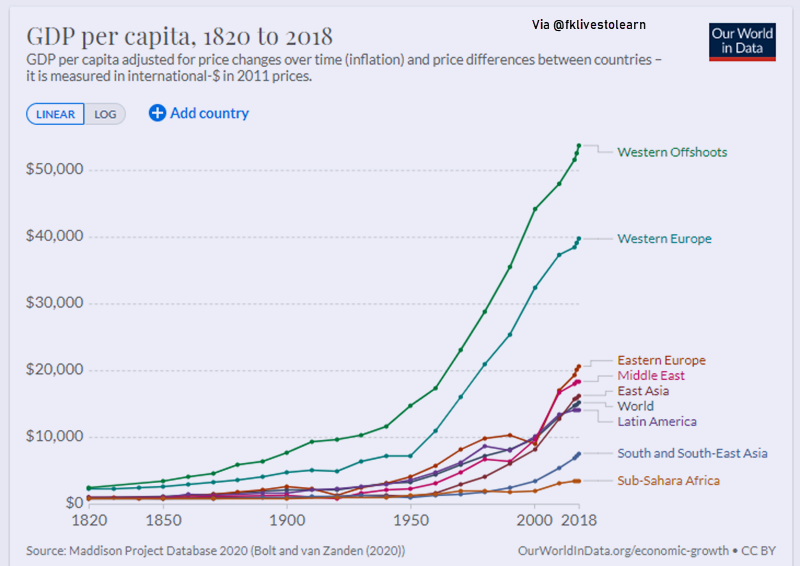
Figure 5 — Trade Union Membership Worldwide
In a significant labor movement, Amazon warehouse workers in Bessemer, Alabama, are campaigning to establish a union, with votes being counted after a pivotal unionization drive in U.S. history. The company has expressed strong opposition to this potential union, which could lead to Amazon's first union in the United States. If successful, the company would be required to enter formal negotiations with the Retail Wholesale and Department Store Union regarding a contract for the 6,000 employees at that facility. Let’s take a look at global trade union membership as a percentage of total employees (Figure 6).
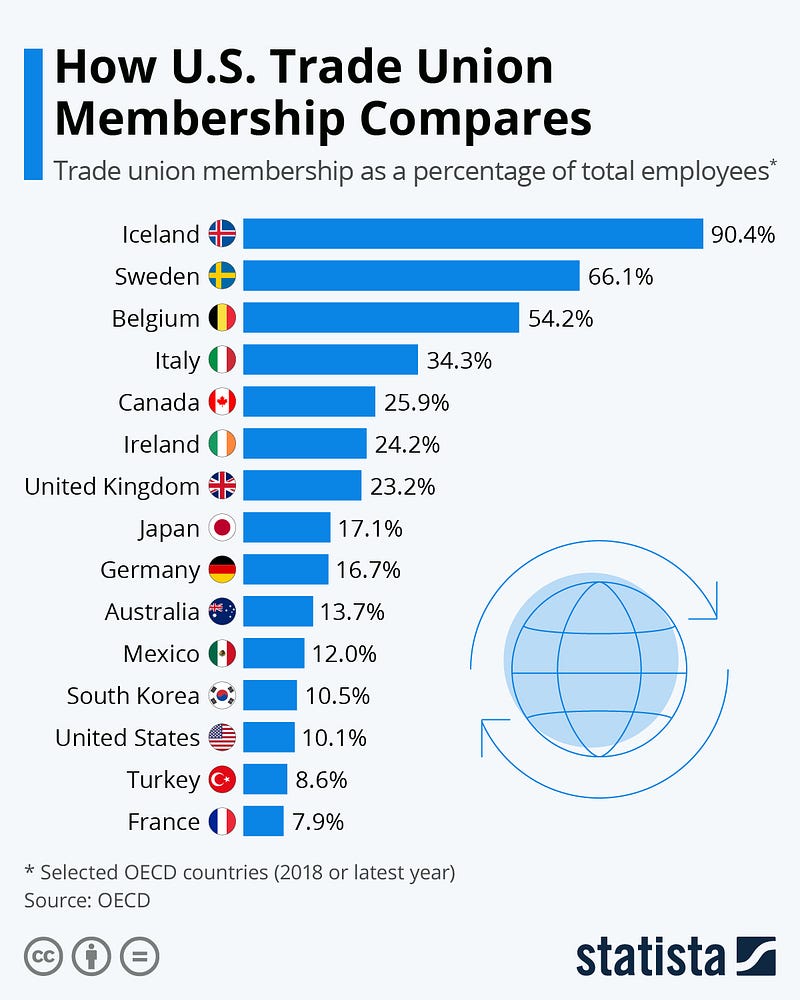
Figure 6 — Tech Giants' AI Acquisitions in 2020
According to CB Insights, in 2020, major tech companies such as Facebook, Apple, Microsoft, Google, and Amazon collectively acquired over a dozen artificial intelligence startups to enhance their existing products and explore new markets. The analysis reveals that FAMGA (Facebook, Apple, Microsoft, Google, Amazon) each acquired at least one AI startup, leading to significant advancements in their services, such as Apple's FaceID and Google's healthcare initiatives through DeepMind.
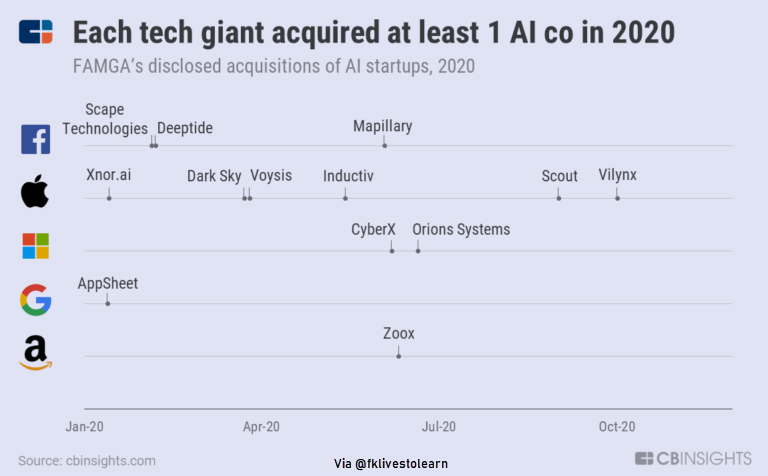
Figure 7 — The Expanding Influence of Big Tech
The scale of big tech firms is becoming increasingly difficult to comprehend as they continue to surpass expectations. The pandemic has accelerated online activities, benefiting the 'FAATMAN' stocks (Facebook, Amazon, Apple, Tesla, Microsoft, Alphabet, and Netflix). With many of these companies achieving record-breaking quarterly results, the following infographic illustrates the revenue generated by these tech giants per minute (Figure 8).
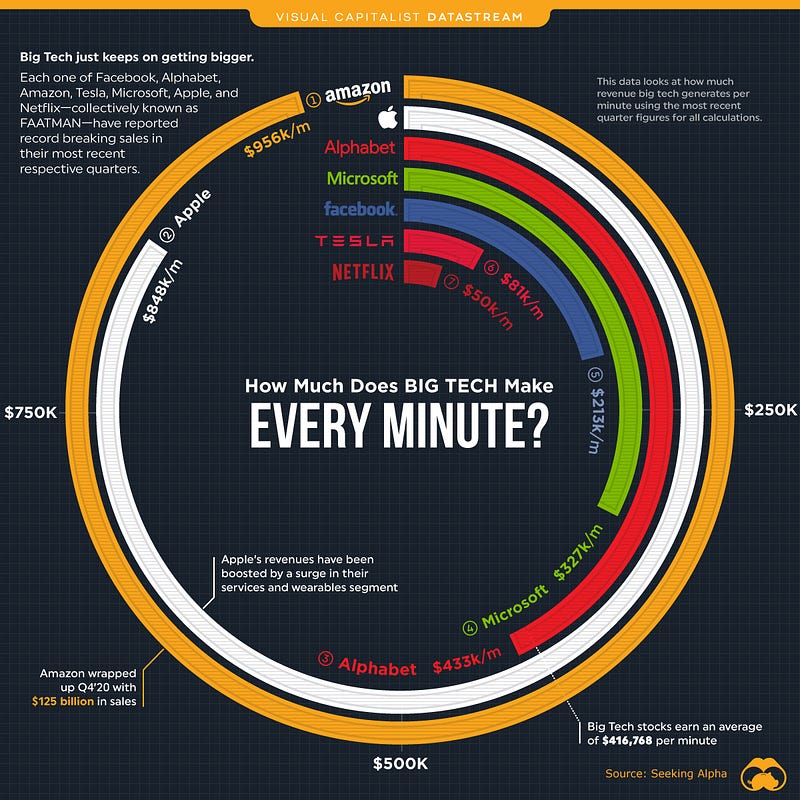
Figure 8 — Humorous Take on Global Recovery Amidst Crisis

Previous Edition of Global Business Week
Stay updated with relevant content— Join my mailing list.